The moose density is not the whole answer. You need to know how sure it is.
We plan, carry out and analyse drone surveys of moose. You get density, sex ratio and calves per cow, every figure with its confidence interval and with a straight verdict on whether the precision is enough for the decisions you have to make.
We build on SLU, and have taken the method further
SLU Rapport 2026.2 shows how a drone survey of moose has to be designed to hold up statistically. We have built that whole chain of calculations in software and get the same answer as the report on 37 of 39 published values. From there we have worked further on the three points where the report leaves the choice to whoever carries out the survey. We are not affiliated with SLU.
We compute the coverage for your area
How much of the area you need to survey depends on how unevenly the moose are spread across the terrain and how many there are. That varies between areas, and it differs between the three measures. A fixed rule of twenty percent therefore misses on at least one of them. We measure the spread in a pilot round and compute the coverage from it, and we size it on a conservative upper bound instead of on the point estimate, because the point estimate falls short of the target roughly every other time. It costs somewhat more flight time. It is the difference between a survey that holds and one that happens to hold.
We measure the detection rate, we do not assume it
We fly a quarter of the sample plots again, and match the animals between the two flights. Then we know what share the survey actually saw, in the weather and the light of that particular day, and we can correct the density for what was missed. Without that measurement a count is only a lower bound, and nobody knows how far below.
That holds whoever finds the moose in the images, a person or a model. Automatic identification has its own share of false negatives, animals it does not see, and its own share of false positives, things it takes for moose. That share carries straight into the density if nobody measures it. SLU counts evaluating exactly these false positive and false negative detections in AI-based identification as one of four open research areas (SLU Rapport 2026.2 §5), and several of the drone companies say in the same report that the systems are not yet accurate enough to replace manual interpretation and control in every situation (§4.5). Flying plots again measures what was missed, whoever or whatever was looking.
We test the plot layout before we set a price
SLU's selection rule is one of several. We set it against spatially balanced and clustered layouts in simulation and work out how many sample plots each needs for the same precision. Then we know what a different layout is worth in field days before we put a price on it.
From area boundary to finished report
You give us a boundary and get back an estimate you can make decisions on.
- We fetch your areaMoose management areas (ÄFO) and moose management units (ÄSO) we fetch directly from the county administrative board's map service. If you have your own boundaries, we read them in. Everything is computed in SWEREF 99 TM.
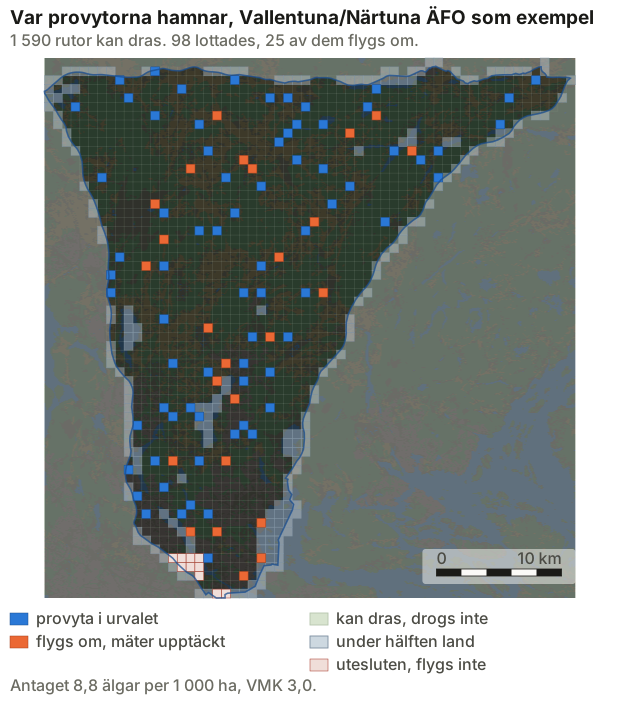
- We lay the grid and select the sample plotsA grid over the area, the edge cells clipped to the boundary, and the sample plots chosen at random in a way that can be repeated. Anyone can redo the selection and get exactly the same plots.
- We clear away airspace and obstaclesRestricted areas and control zones from LFV. National parks, nature reserves and access bans from Naturvårdsregistret. Built wind turbines from Vindbrukskollen. Power lines, masts, towers and chimneys. What we exclude, we write out, and what the pilot only needs to keep in mind ends up as a flag on the field sheet.
- The routes follow the groundEvery route lies 100 m above the ground, not above the launch point, computed from elevation data and a geoid model. In hilly terrain that is the difference between the right image coverage and gaps between the flight lines.
- The mission is flownOne .kmz per sample plot and drone model in DJI's WPML format, read back and checked against the format before it goes into the field. With it come the visiting order, field days, suggested launch points, a sample plot map and a field sheet in Swedish.
- We verify that it was flown as plannedFrom the flight log we check height, speed, overlap and that the right plots were covered. A plot that was not flown to specification does not count as flown.
- The report is written by the softwareThe counts per sample plot go in. Out come density, sex ratio and calves per cow with bootstrapped confidence intervals, the density corrected for the detection rate, and a verdict on whether the precision was enough. Nobody copies figures by hand.
The same report every year
You get the same report every time: the same measures, the same order, the same account of uncertainty. Every figure stands with its interval. A measure that does not reach the precision target we write out as no verdict, instead of leaving you a figure that cannot be used.
The supporting record comes with the report: the plot selection, the map data and the date of every download. An estimate should be possible to scrutinise afterwards, and to compare with next year's. The method stays with us and carries over between years, so your time series is not broken.
What is built, and when we take assignments
The chain of calculations is built, and every step in it is checked automatically before anything leaves us. Our method for setting the coverage is validated against SLU's own simulations. The planning runs all the way from an area boundary to finished mission files, sample plot maps and field sheets.
Automatic identification of moose in thermal images we have not built, and we do not sell it. Openly available models for that task are being examined in an ongoing master's thesis at SLU (§5). We will take such a model in the day its error rate can be measured, not before, because it only moves who is looking and changes nothing in the estimate. Nor is that where the difficulty lies: in cold, overcast winter weather SLU estimated the detection rate at close to 1 (§5). What is missing is determining sex and age, which has not yet been developed for drone images (§4.5). If we build anything on this side of the method, it will be there, and only once enough of the animals in the images can have their sex and age determined. In SLU's sample plot survey on Järnäshalvön that was possible for 42 % of the observed moose (§3.1).
The 2026/27 season is the first we take assignments for.
Red deer in the same survey
If you have red deer on the land, they show up on the same flights as the moose. The design is the same: sample plots selected at random, the spread measured in the pilot round and the density reported with its confidence interval. The red deer are counted separately, and the coverage is set by whichever species needs the most.
But nobody has tested the method on red deer. SLU's report is about moose, and the detection rate close to 1 that SLU measured is for moose. By day, red deer often stand in dense plantations and in groups. What share a drone sees there, nobody knows yet, and the groups may need more sample plots than the moose. Flying plots again shows what two flights miss, but not animals that neither of them sees under a dense canopy. Sex and age in red deer have not been tested from the air, so there we promise nothing. If you manage both moose and red deer, get in touch, and we will run the numbers for your area.
Read on about moose surveys
- What SLU's report says What the report tested, what it found and what it leaves open.
- Moose surveys for landowners What you get, what it asks of you, and what a year looks like.
- How to read the survey report What a confidence interval means, and when a figure cannot be used.
- How a moose survey is flown Flight parameters, terrain following and what we exclude before anything takes off.
- What a moose survey costs (in Swedish) Why the price follows the number of moose you need to see, not the area.
- How many sample plots are needed (in Swedish) The arithmetic behind the number, and why a fixed rule misses.
- Compared with other ways to count moose (in Swedish) Helicopter, pellet counts and hunter observations, and when drones are the wrong choice.
- Rules and obstacles we check against (in Swedish) Airspace, protected areas and tall obstacles, excluded or flagged.
- When in the year the survey is flown (in Swedish) What the weather and the light require, and why the season needs slack.
- Moose survey glossary (in Swedish) Coverage, detection rate, variance-to-mean ratio and the other words.
Contact
Get in touch if you manage land, own it, or do research on deer and moose. We are glad to answer questions about the method.