How to read the report from a moose survey
The report is written to be questioned. This is what the different numbers mean, and what to look at first.
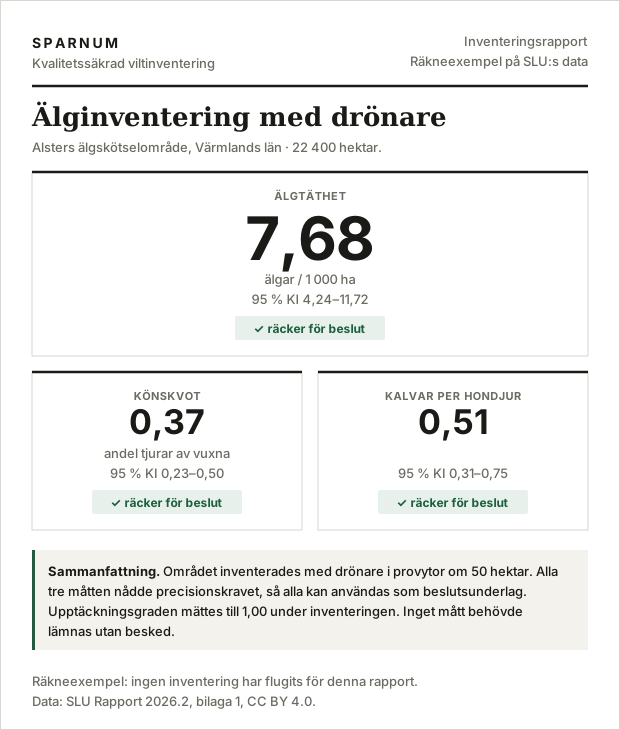
The figure and the interval belong together
Every measure comes with a 95 % confidence interval. The interval says where the true value reasonably lies, given how much was surveyed and how unevenly the animals were spread. It is not a disclaimer. It is the most important part of the answer.
Two surveys can give the same density and still be worth completely different things. Seven moose per thousand hectares with an interval of five to nine is something to base a decision on. The same seven with an interval of zero to seventeen only tells you there are moose. Read only the point estimate and you cannot tell them apart.
Relative interval width: how precision is compared between years
To compare precision between measures and between years, we give the width of the interval divided by the estimate. A lower number is a surer figure. The research rule of thumb is that the width should be no larger than the estimate itself, and that is the limit we report against unless you have agreed on another.
Two widths go by the same name, and it pays to keep them apart. One is how much the estimate would spread if the same area were surveyed over and over. That is the one SLU works with, and the one we size the survey against: coverage is set so that it comes out no larger than the estimate, and the verdict on whether precision is enough is given against it. The other is the interval in your report, computed from your own sample plots. Where moose stand in clusters it has to be skewed and a little wider to catch the true value 95 times out of 100. In our simulations with the same clustering as in Alster and Fredrika, the median came out at 1.1 and 1.2 respectively. So you will more often see a figure just above 1 than below it, even when the survey is correctly sized.
The limit is negotiable, and it should be negotiated. A harvest decision can tolerate a different uncertainty than a research study. What matters is that the level is set before the survey and not after, because a requirement set when the answer is already known is not a requirement.
No verdict: when the record is not enough for a measure
Sometimes the report says no verdict instead of giving a figure. It means the survey did not produce enough data for that particular measure, usually because too few animals of the right category were observed. Sex ratio and calves per cow need more data than density, because they rest on a subset of the observed animals.
We would rather write no verdict than leave a figure that looks usable and is not. A number with an interval from zero to double its value is not an answer, and presenting it as one is the only way to do real harm with a survey.
Coverage: how much of the area is surveyed
Coverage is the share of the area that was surveyed. It decides the precision, but how large it needs to be cannot be known in advance: it depends on how unevenly the animals are spread in your area and how many there are. So we start with a pilot round and work out the requirement from it, instead of using a fixed rule.
The report states both the coverage that was flown and the coverage that was required. If they differ, that explains the precision you got.
Detection rate: how large a share of the moose is seen
No survey sees every animal. The detection rate is the share that was actually seen, and it varies with weather, light and vegetation. We measure it by flying a quarter of the sample plots again and matching the animals between the two flights, and we correct the density for those that were missed.
A survey that does not report its detection rate always gives an underestimate, and nobody knows by how much. It is the difference between knowing you saw seventy percent of the animals and hoping you saw them all.
The supporting record: what makes the report checkable
With the report comes the list of sample plots that were chosen, which map data was used and when it was fetched. The selection can be repeated and gives exactly the same plots. You should be able to hand the report to someone else, including the county administrative board (Länsstyrelsen) that reviews your plan, and ask them to check the arithmetic.
The figure in the moose management plan: read the interval against the target
Most plans have a target for the winter population, often as a range in moose per 1 000 ha. So the question the plan asks is not what the density is, but whether it lies above, below or within the target. It is the interval that answers that, not the point estimate.
If the whole interval lies above the target, you know the population is too large, and the harvest can rest on that. If it lies wholly below, you know the opposite. If the interval overlaps the target, that is an answer too: the survey cannot tell the population from the target, which is a reason to be careful with large changes to the harvest, or to survey more densely next time. That is exactly the answer a figure without an interval can never give.
Does Länsstyrelsen accept a drone survey?
The short answer is that no county administrative board, as far as we have been able to see, has said yes or no. The decisions we have read review moose management plans against SLU's estimates in LSTmoose and Skogsstyrelsen's browsing survey (ÄBIN). Drone surveys already appear in approved plans as planned surveys: Länsstyrelsen in Södermanland approved a plan in March 2026 in which several moose management units plan to survey with drones, without commenting on it (decision 2026-03-26, dnr 2398-2026). We have not found any decision that weighs a drone figure.
Naturvårdsverket said in August 2026 that more evidence is needed before the method can be approved (Svensk Jakt, 26 August 2026). SLU's report is not an approval, it is an evaluation (see what the report says). Until then, the strongest thing a drone figure can carry with it is an interval and a supporting record that whoever reviews the plan can recompute themselves. That is what we deliver.
Read more about moose surveys
- What SLU's report says What the report tested, what it found and what it leaves open.
- The method behind the moose survey What we build on, and where we have taken it further.
- Moose surveys for landowners What you get, what we need from you, and what a season looks like.
- How a moose survey is flown Flight parameters, terrain following and what we rule out before anything takes off.
- Moose survey glossary (in Swedish) Coverage, detection rate, variance-to-mean ratio and the other terms.
- How many sample plots are needed (in Swedish) The arithmetic behind the number, and why a fixed rule misses.
Contact
Would you like to read the whole sample report and not just the first page? Get in touch and we will send it.